Custom Power BI visuals development
GRSP Tech has been an exceptional partner. Their high-quality work and experience benefit any engagement. While communication could improve, their team still delivers top-notch value. Customers can expect an analytical team built for long-term relationships.
View full review on Clutch

Technology stack
Background
Objective
Requirements & Scope
- Customizability - The visuals should be easily customizable to match the client's branding and reporting requirements.
- Intuitiveness - The visuals should be easy to understand and navigate for non-technical users.
- Flexibility - The visuals should be able to handle custom data models.
- Performance - The visuals should be fast and responsive, even when handling large amounts of data.
Solution
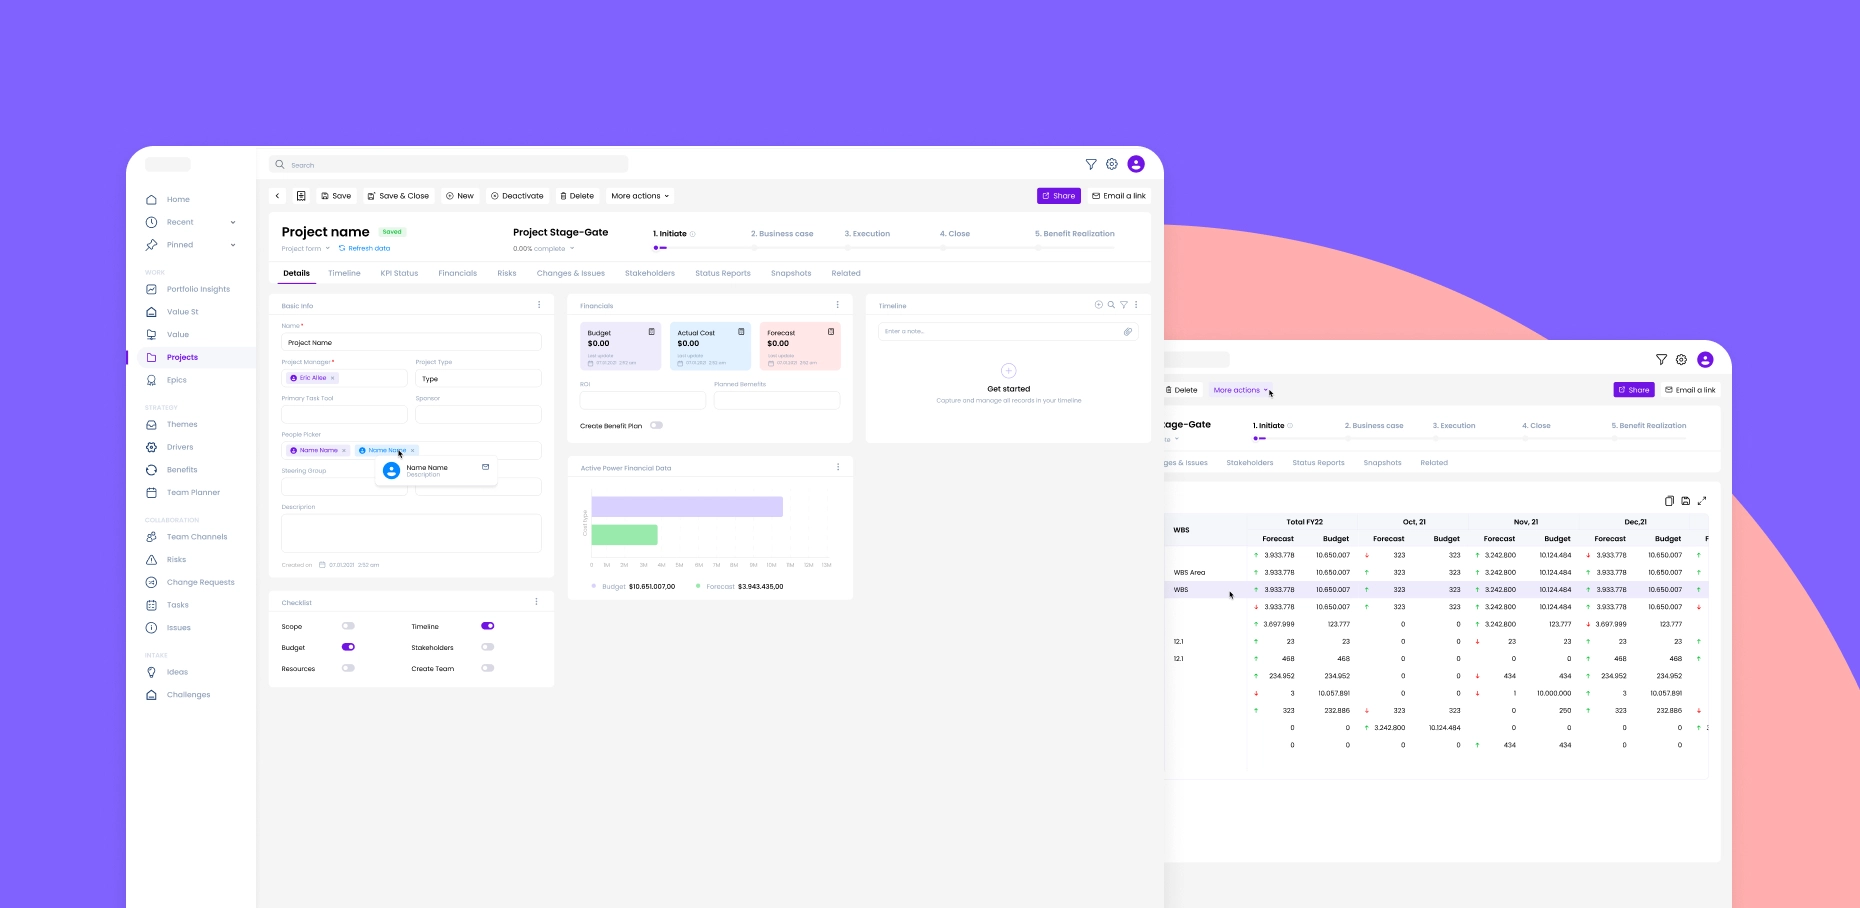
To address these requirements, we developed a set of custom Power BI visuals using TypeScript, a popular programming language for building scalable and maintainable web applications. Our development team worked closely with the client's project management experts to understand their data and reporting requirements, and to design visuals that would best represent their project timelines and KPIs.
The custom visuals we developed included a Gantt chart that could be used to visualize project timelines, as well as a set of KPI charts that could be used to track project performance. These visuals were designed to be fully customizable, and work with the specific customer data model. All the visuals had specific features, that cannot be achieved by using standard Power BI visuals. For example, the Gantt chart visual had clustering, expand/collapse, and custom indicators.
In addition, we implemented several performance optimizations to ensure that the visuals remained fast and responsive even when handling large amounts of data – there could be up to 10,000 records for the Gantt chart visual. We also provided detailed documentation and support to ensure that the client's project management experts could easily use and customize the visuals as needed.
Results
After successfully implementing our custom Power BI visuals, the client company saw immediate improvements in its project management reporting capabilities. The new visuals allowed them to visualize their project timelines and KPIs in a way that was both customizable and intuitive, which helped their project management experts make more informed decisions about their projects.
Furthermore, since the visuals were fully integrated into their existing Power BI reporting ecosystem, the client was able to use them seamlessly alongside their existing reports and dashboards. This helped them save time and resources by not having to switch between different reporting tools.
Overall, our custom Power BI visuals provided the client with a powerful toolset for visualizing their project management processes and KPIs, which helped them improve their project management capabilities and deliver better outcomes for their clients.
Other projects
 Transportation
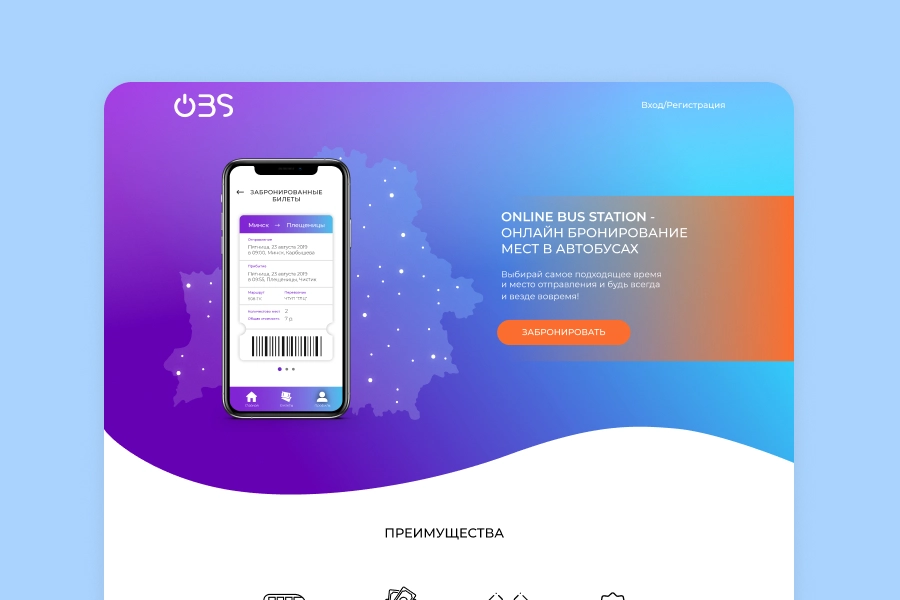
OBS
The transportation project developed a suite of web and mobile applications that simplify bus fare purchasing for riders and enhance coordination between dispatchers and drivers, utilizing technologies like Node.js, Angular 2, and MongoDB. This initiative has led to increased convenience for riders, improved communication for transportation professionals, and overall elevated customer satisfaction within the bus transportation industry.
 Manufacturing
Program Management and Strategic Resource Planning
The global manufacturing company implemented the Microsoft Project Management Suite, including MS Project Online, Power Apps, and Power BI, to streamline resource planning, enhance collaboration across departments, and improve project tracking. This led to increased operational efficiency, better stakeholder communication, timely project completions, and new business opportunities due to enhanced process visibility.
 E-commerce
Marknadsplats
For the Swedish media company, Marknadsplats.se, a customized e-commerce platform was developed to facilitate secure and user-friendly digital transactions between buyers and sellers. Utilizing technologies like Node.js, React.js, and AWS, the platform offers features like secure payment processing, real-time messaging, and is optimized for desktop and mobile devices, ensuring a seamless user experience and adaptability for future business needs.
Let’s discuss
your project!